Expansion Revenue: The Metric That Separates Compounders From Leaky Buckets
If your net dollar retention is below 100%, you are buying growth you cannot keep
I track around 40 B2B SaaS companies closely enough to see their cohort data. The single best predictor of which ones will be around in five years comes down to one thing: whether existing customers spend more money over time. Not growth rate, not market size, not the caliber of their investors.
That is expansion revenue. And the companies that generate it reliably live in a different economic universe than the ones that do not.
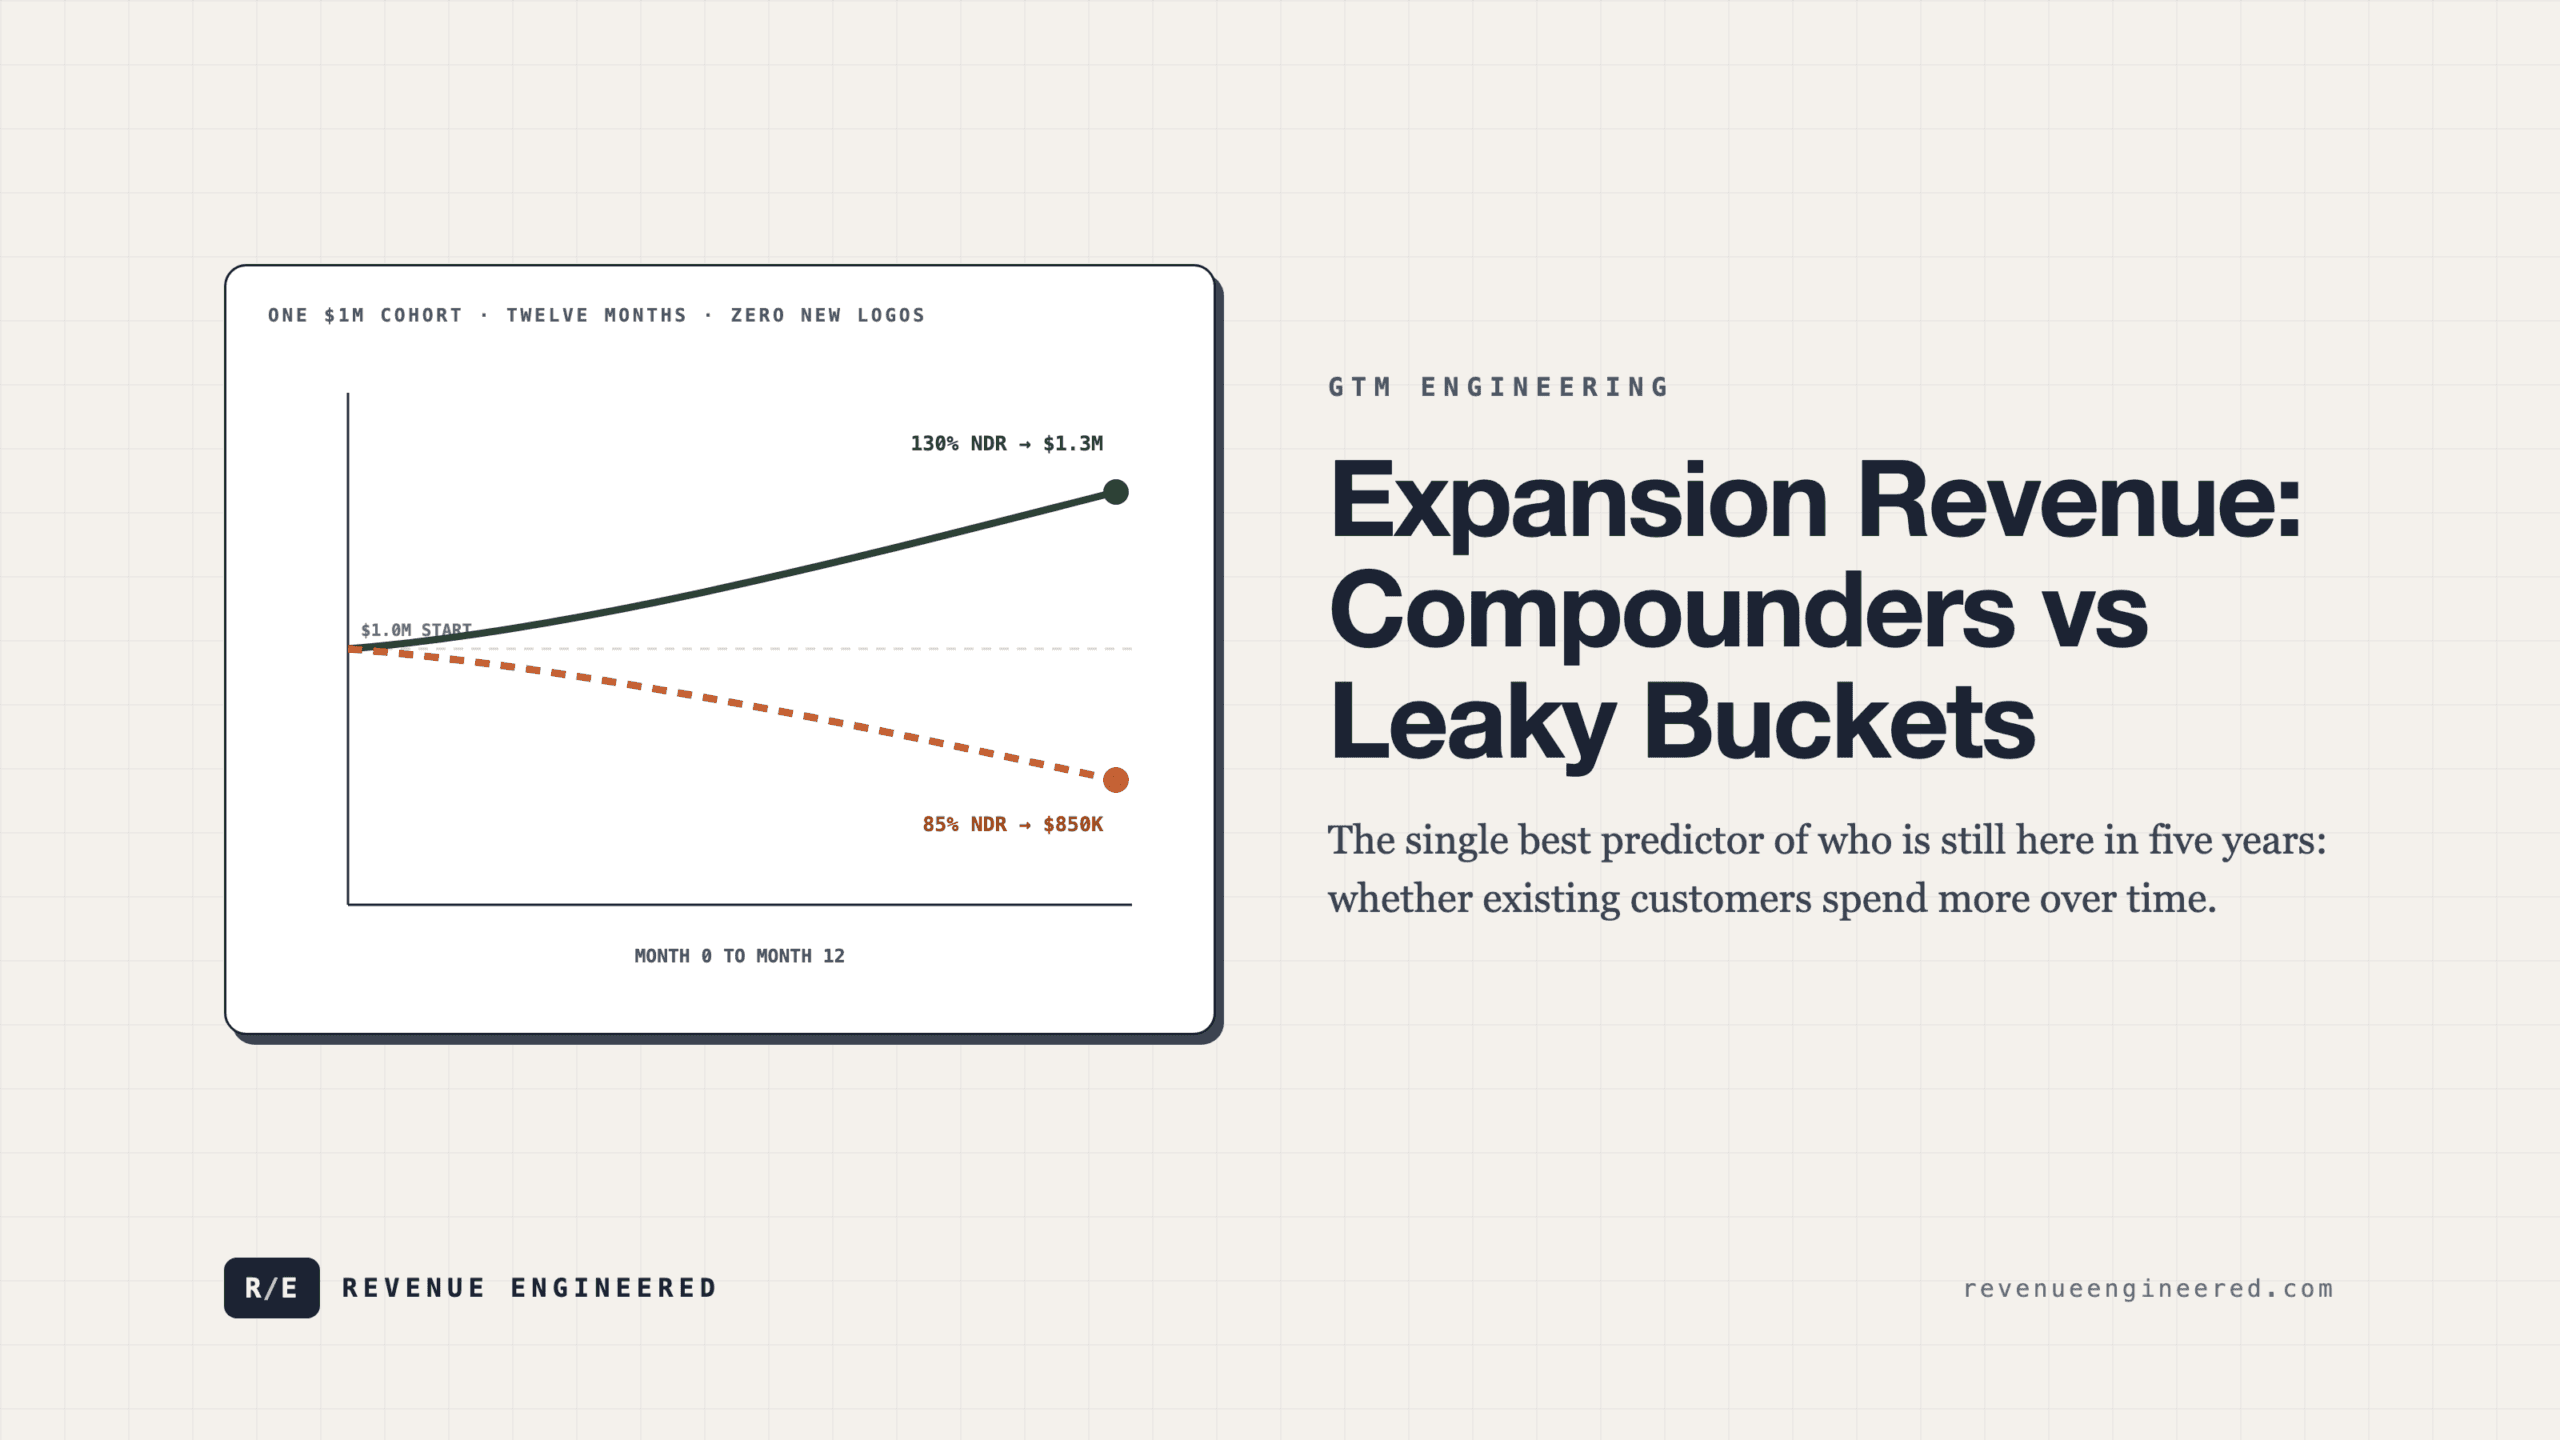
The dividing line is net dollar retention. NDR measures how much revenue you keep from a group of existing customers over a twelve-month period, after accounting for churn, contraction, and expansion. A company with 130% NDR takes a cohort paying $1 million at the start of the year and collects $1.3 million from that same cohort twelve months later. No new logos required. The existing base grew 30% on its own.
A company with 85% NDR takes that same $1 million cohort and watches it shrink to $850,000. The difference between these two scenarios is the difference between compounding and decay. Nothing marginal about it.
Research across public SaaS companies shows that those with NDR above 130% grow 2-3x faster than peers with NDR below 100%, regardless of how aggressively the lower-NDR companies acquire new customers. The expansion revenue is a growth multiplier that acquisition alone cannot replicate. You can outspend a compounder on sales and marketing for years and still fall behind, because their revenue base is growing while yours is shrinking underneath the new logos.
The funnel of doom

funnel of doom reframed as system design.
Most B2B companies are built around acquisition. The entire GTM apparatus points at new logos. Pipeline meetings count new opportunities and board decks celebrate new ARR. Comp plans reward new business. Expansion, if it is tracked at all, gets a line item in the quarterly review that nobody argues about.
This creates what I call the Funnel of Doom.
It works like this. A company raises a Series A on strong initial growth. New logos are flowing. Top-line revenue looks healthy. But the cohort data underneath tells a different story. Gross retention is 82%. One in five revenue dollars walks out the door every year. Expansion from remaining customers is minimal because the pricing model does not grow with customer usage and the product does not naturally create upsell opportunities.
The company responds the only way it knows how: more acquisition. More SDRs, more paid spend, more channel partners. Top-line continues to climb. The board is satisfied.
By Series B, the math starts to crack. The company needs to acquire $1.50 in new revenue for every $1.00 of net growth, because the base keeps eroding. CAC payback stretches from 14 months to 24, then to 30. The growth story that justified the last round now requires twice the capital to sustain.
This is the dominant failure mode between Series A and Series C, not some rare edge case. These companies do not run out of market. They run out of economic runway because their revenue model leaks faster than they can fill it. The funnel gets wider at the top and emptier at the bottom. Every quarter, you have to pour more in just to maintain the same level.
The shape is exactly right. Wide at the top, narrow at the bottom, and the contents drain the moment you stop pouring.
SmileDirectClub and the acquisition-only endgame
SmileDirectClub is the most dramatic illustration of what happens when a company scales acquisition without any expansion mechanism, even though it is a consumer business. The pattern maps directly to B2B.
SmileDirectClub grew to nearly $750 million in annual revenue through aggressive customer acquisition. Direct-to-consumer marketing at massive scale. Celebrity endorsements. Retail partnerships. Digital advertising across every channel. They went public in 2019 at a $10 billion valuation. The trajectory looked spectacular from the outside.
The problem was structural. Every customer was a one-time transaction. Someone bought aligners. Treatment ended. They were done. There was no recurring relationship. No mechanism for an existing customer to spend more over time. Zero expansion revenue.
SmileDirectClub spent over $1 billion on customer acquisition across its lifetime. When acquisition costs rose, as they do in every paid channel given enough time and competition, the business model collapsed. Revenue peaked and then declined. Marketing efficiency deteriorated quarter after quarter. The company filed for bankruptcy in late 2023.
Nearly $750 million in peak revenue. None of it compounded. Every dollar had to be re-acquired from scratch, every year, at increasing cost.
The B2B equivalent plays out on a slower timeline but follows identical logic. Companies selling flat annual contracts with no usage-based component, no natural expansion vector, and no upsell motion embedded in the product experience are running the same playbook. Their NDR sits at 90% or 95%, which looks respectable until you do the math on what it costs to replace the 5-10% that leaves every year while still growing.
Growth loops versus funnels
Expansion revenue matters so much for a deeper reason than cost, though it is cheaper than acquisition, typically 3-5x cheaper per dollar of ARR. It converts a linear funnel into a compound growth loop.
A funnel is one-directional. Prospect enters the top. Moves through stages. Converts. Pays. If they churn, you need another prospect. The cost of growth is directly proportional to the number of new customers required, which is directly proportional to your churn rate. Funnels do not compound. They operate on a replacement cycle.
A growth loop works differently. Customer succeeds with the product. Usage grows. They integrate more deeply. Switching costs rise. Through word of mouth, case studies, or referral mechanics, they bring in new customers who follow the same path. The output of one cycle feeds the input of the next.
Expansion revenue is the fuel that makes this loop spin. Without it, a customer’s value to your business is fixed on the day they sign. With it, the value increases over time. A customer acquired for $10,000 who expands from $50K to $90K ARR over three years has a fundamentally different lifetime value than one who stays flat at $50K. And that expanding LTV means your original acquisition cost was actually cheaper than you thought when you spent it.
At 130% NDR, your existing customer base generates a 30% annual revenue tailwind before you close a single new deal. That surplus funds product investment, which improves the experience, which drives more expansion. The flywheel accelerates.
Companies with 90% NDR spending three times more on marketing still grow slower than companies with 130% NDR spending modestly on acquisition. The compounding effect dominates over time.
Usage-based pricing as expansion engine

Usage-based pricing as expansion engine as a maturity path.
The most reliable mechanism for generating expansion revenue is pricing that grows automatically with customer success.
Usage-based pricing does this without requiring a sales conversation. When a customer sends more messages through Twilio, Twilio earns more. When a customer processes more data through Snowflake, Snowflake earns more. The expansion happens as a byproduct of the customer getting value. No upsell motion needed. No CSM asking for a meeting. No renewal negotiation where the customer tries to lock in a flat rate.
This is why usage-based models dominate the infrastructure and developer tools layer. Twilio, Stripe, Snowflake, Datadog. These companies generate massive expansion revenue because the alignment between customer success and revenue growth is structural. It is built into the pricing, not grafted on through a sales process.
Seat-based models generate weaker but still meaningful expansion. Organizations grow and add users. The friction is higher because someone has to decide to add seats, which creates a decision point where the customer evaluates whether the incremental spend is justified. Feature-tiered models face the same dynamic. Someone has to actively choose to upgrade.
The hybrid model that many companies are converging on combines a platform fee for revenue predictability with usage-based components for expansion. A base subscription covers core access. Usage charges layer on top for variable components that correlate with customer growth. This gives you stable baseline revenue and natural expansion as customers succeed.
It also creates a health signal. Usage growing? Customer is getting value. Usage declining? Something is wrong. That signal is more honest than any NPS score or QBR conversation.
Measuring the right things
If expansion revenue is this important, why do most companies measure it poorly?
Because their reporting systems were designed for acquisition. The CRM tracks new deals. Pipeline reports count new opportunities. Board decks lead with new ARR and net new logos. Expansion often gets lumped into a single line or, worse, buried inside the renewal number without being broken out.
Four metrics matter.
Gross retention rate: how much revenue you keep from existing customers before expansion. This is your churn signal, pure and simple. Below 85% means you have a product-market fit problem that no expansion can offset. You are losing too many customers.
Net dollar retention: how much revenue you keep after both churn and expansion. Above 100% means you are growing from the base. Above 120% means you are compounding aggressively. Below 100% means you are on the treadmill.
Expansion rate per cohort: how much additional revenue each customer cohort generates over time. Healthy expansion curves show growth in months 6 through 18, then a plateau. Unhealthy curves show a spike in month 2 from initial onboarding, then flatline. The latter means your expansion is front-loaded and not durable.
Time to first expansion: how long until the average customer increases spend beyond the initial contract. Median of 3 months indicates strong natural expansion mechanics. Median of 12 months means your expansion motion is slow. If this number is increasing quarter over quarter, something in your onboarding, product, or pricing is degrading.
Building the expansion engine

Building the expansion engine translated into operating choices.
Start with pricing architecture. If your pricing does not grow with customer success, you are leaving expansion revenue on the table structurally. You need at least one vector that increases as the customer gets more value. Seats. Usage volume. Data processed. Features unlocked. Integrations active. Pick the metric that correlates most directly with the customer’s success and tie pricing to it.
Build expansion signals into product analytics. You need to know which customers are approaching the boundary of their current plan. Which accounts show growing usage trends. Which customers hit feature limits from a higher tier they have not purchased. This data should flow to customer success and product, not just sales.
Remove friction from the expansion path. If a customer has to schedule a call with a rep to add seats or upgrade their plan, you have inserted delay and a decision point that kills expansion velocity. Self-serve expansion generates more revenue than sales-assisted expansion in almost every company I have measured. The exception is enterprise accounts where the expansion involves a significant contract restructuring.
Invest in customer success with an expansion mandate. CS teams that only focus on churn prevention play defense. The best CS organizations carry a dual mandate: keep customers healthy and help them grow. Proactive usage reviews. ROI documentation that justifies increased investment. New use case identification within the account. A CS team with an expansion target operates fundamentally differently than one with only a retention target.
The compounding math
I will close with the math, because the math is the entire argument.
Company A: 90% gross retention, no meaningful expansion, 90% net dollar retention. To grow revenue 30%, they need to add 40% in net new ARR because 10% of their base erodes every year.
Company B: 90% gross retention, 40% expansion from remaining customers, 126% net dollar retention. Their existing base grows 26% on its own. To achieve 30% total growth, they need to add just 4% in net new ARR.
Both companies hit 30% growth. But Company A needs ten times more new business to get there. Their sales team is larger, their marketing budget is higher, and their burn rate is greater.
Company B takes the savings and invests in product, customer success, and the pricing mechanics that drive further expansion. The gap between these two companies widens every quarter. After three years, it is nearly insurmountable.
That is the difference between compounding and leaking. It starts with one number. Measure it. Build for it. Make it the metric your company optimizes around. Everything else follows.
Enjoying this essay?
Written by

Elom
GTM, growth, and revenue systems operator with 12 years across Fortune 500s, fintech, and B2B startups. Building at the intersection of AI, data, demand, and revenue.
Get the next deep-dive in your inbox
Essays on demand creation, GTM, growth engineering, and revenue systems. Free.