Signal-Based GTM: The 60-Playbook Framework That Replaces Lead Scoring
Lead scoring treats all engagement the same. Signal-based GTM runs 60 different response patterns, and it’s generating $1.5M+ pipelines.
A VP of Revenue Operations at a Series B company told me something last month that stuck. They had spent eighteen months building what they described as a “beautiful” lead scoring model. Behavioral weights, firmographic multipliers, decay functions, the whole apparatus. Their MQLs were up 40%. Revenue was flat.
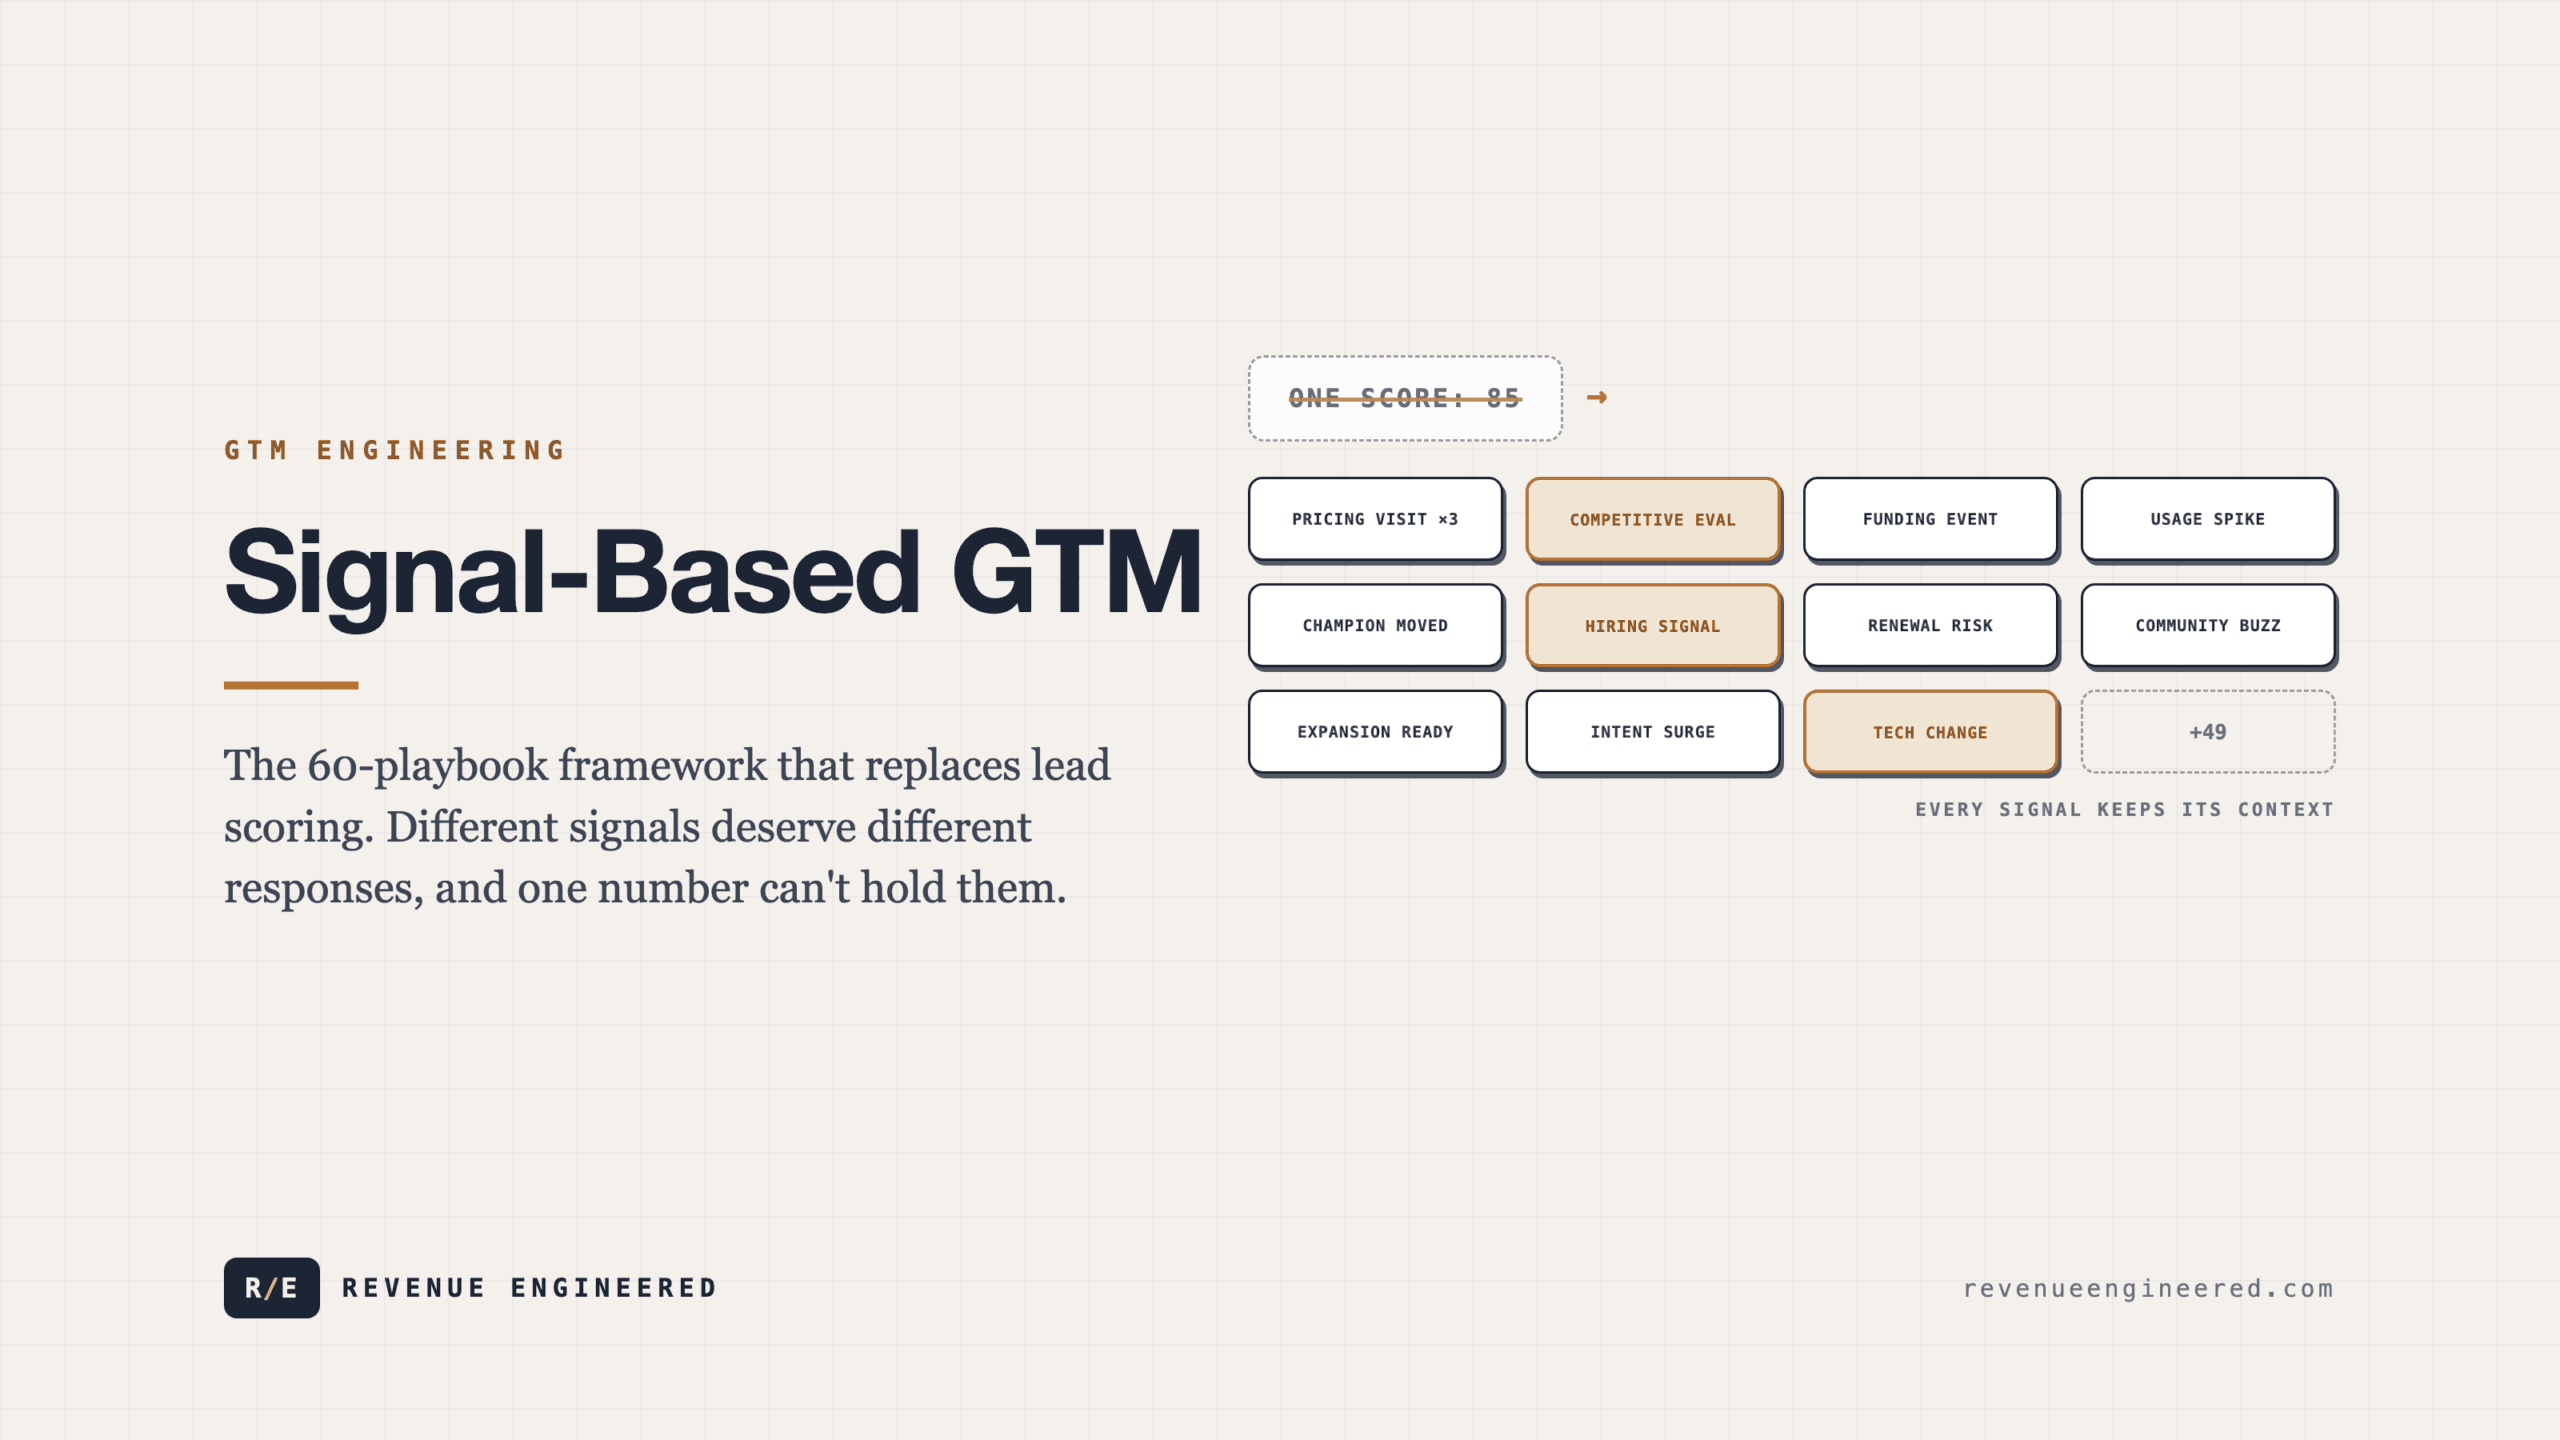
The problem was not the math. The problem was the premise. Lead scoring takes dozens of different buying signals, collapses them into a single number, and routes every lead through the same handoff process. A prospect who visited your pricing page three times gets the same treatment as a prospect who downloaded a whitepaper. A company that just raised a Series B gets the same sequence as one that posted a job listing for your exact persona. The score might be identical. The intent is completely different.
Signal-based GTM starts from the opposite assumption: different signals deserve different responses. Not one score. Sixty playbooks. Each one triggered by a specific buying signal, each one executing a tailored response sequence. The companies running this architecture are generating pipeline at levels that make traditional lead scoring look like a rounding error.
Why lead scoring broke

Why lead scoring broke reframed as system design.
Lead scoring was invented in an era when the primary challenge was volume. Marketing generated too many leads for sales to call, so you needed a way to prioritize. Assign points for email opens, page visits, form fills, job title matches. Add them up. Pass the hot ones to sales.
The model worked when buying behavior was linear and observable. Prospect reads blog post, downloads ebook, attends webinar, requests demo. Each step visible, each step scoreable. The score correlated with intent because the buying journey was contained within channels you could measure.
That buying journey no longer exists. Seventy to eighty percent of the research process happens in channels that produce no measurable signal in your systems: peer conversations, Slack communities, dark social shares, AI search queries, analyst calls your company was not invited to. The prospect who fills out your form might be at the beginning of their journey or at the end of it. The lead score cannot tell you which, because it only sees the 20% of activity that happened on your property.
The deeper problem is that scoring treats all engagement as equivalent once weighted. A pricing page visit and a careers page visit produce the same type of signal in most scoring models: a page view with a point value. But the intent behind those actions is radically different. One signals active buying evaluation. The other signals employment interest. Collapsing them into the same scoring framework loses the information that actually matters.
The 60-playbook architecture
Signal-based GTM replaces the single-score model with a library of discrete playbooks, each one triggered by a specific signal and executing a specific response. The number 60 lands where mature implementations end up once they have covered the major signal categories, not at an arbitrary figure.
The architecture has three layers.
The detection layer identifies buying signals across every available data source. These are not just first-party behavioral signals from your website and product. They include third-party intent data, technographic changes, hiring patterns, funding events, competitive displacements, social engagement patterns, and product usage signals. Each signal type has its own detection mechanism and its own confidence threshold.
The classification layer determines which playbook a signal triggers. A pricing page visit from a target account with recent funding triggers a different playbook than a pricing page visit from an unknown company with no other signals. The classification is a routing decision that preserves the context of the original signal, not a score.
The execution layer runs the playbook. Each playbook defines the response sequence: who gets notified, what outreach happens, through which channel, with what messaging, on what timeline. A “competitor displacement” playbook might trigger an immediate SDR call with competitive positioning materials. A “product usage spike” playbook might trigger a customer success outreach with expansion messaging. A “hiring signal” playbook might trigger a long-nurture sequence with relevant content.
Sixty playbooks sounds like a lot. In practice, they cluster into about ten categories with five to eight variations each. The categories correspond to the major signal types: intent signals, product signals, firmographic changes, competitive signals, engagement signals, timing signals, community signals, referral signals, expansion signals, and renewal risk signals.
From lead-centric to account-centric
Signal-based GTM requires a fundamental shift in how you think about pipeline generation. The unit of analysis is no longer the lead. It is the account.
Traditional lead scoring evaluates individuals. John from Acme Corp has a score of 85. But John is not the buyer. John is one of six people involved in the buying decision, and his individual engagement level tells you almost nothing about whether Acme Corp is actually in market.
Account-level signal detection aggregates signals across every person at a target company. Three people from the same account visiting your pricing page in the same week is a signal that no individual lead score would capture. A job posting for a role that uses your category, combined with a recent funding round, combined with a competitive product reaching end of contract: that is a buying signal that exists only at the account level.
The companies running signal-based GTM are building what I call circular lookalike models. Instead of starting with a static TAM list and working down, they start with their best existing customers, identify the signal patterns that preceded those deals, and continuously scan the market for accounts exhibiting the same patterns. The TAM is a living detection system that surfaces new accounts as they enter buying cycles, not a static list.
Multi-threading follows naturally from account-level signals. When the system detects that Acme Corp is in an active buying cycle, it does not route a single lead to a single SDR. It identifies every relevant contact at the account and orchestrates parallel outreach across roles: economic buyer, technical evaluator, champion, end user. Each contact gets messaging tailored to their role and the specific signals the account is showing.
The data orchestration layer
None of this works without a data foundation that most companies do not have. Signal-based GTM requires real-time data enrichment at a scale that manual processes cannot support.
The enrichment stack typically includes five to eight data providers running in sequence. A waterfall architecture where each provider fills gaps the previous one missed. Company data from one provider. Contact data from another. Technographic data from a third. Intent data from a fourth. The goal is a complete, current record for every account and contact in your detection system.
Clay has emerged as the orchestration layer for this stack. Not because it is the only option, but because it solves the specific problem signal-based GTM creates: you need to run conditional enrichment across multiple providers, apply business logic at each step, and produce structured output that triggers downstream playbooks. Doing this with a pile of Zapier connections and CSV exports is technically possible and operationally miserable.
The enrichment architecture matters because signal quality determines playbook accuracy. If your technographic data is six months stale, your “competitive displacement” playbook fires on companies that already switched. If your contact data is incomplete, your multi-threading playbook sends to the wrong people. The orchestration layer is the foundation that determines whether your playbooks hit or miss, not mere infrastructure overhead.
What this looks like in practice

What this looks like in practice as a maturity path.
Here’s a concrete example from a company running 40+ playbooks.
Signal detected: three employees at a target account visited the comparison page (vs. their current vendor) within a five-day window. One of those visitors holds a VP title. The account had a funding round 90 days ago.
Playbook triggered: “Active competitive evaluation, funded, senior engagement.”
Execution sequence: Within two hours, the assigned AE receives a Slack notification with a pre-built account brief including the competitive context, the VP’s LinkedIn profile, recent company news, and the specific pages visited. A personalized email from the AE goes out the same day referencing the specific competitive gap their comparison page revealed. The VP gets a separate outreach through LinkedIn with a different message focused on the strategic outcome, not the product comparison. A custom one-pager comparing the two products on the dimensions that matter for their company size and industry gets generated and staged for the first reply.
Compare that to a lead with a score of 92 getting routed to the next available SDR. This is a system that preserved the full context of the buying signal and executed a response tailored to that specific context. The difference in conversion rates between these two approaches is not incremental. Companies running signal-based architectures report pipeline generation exceeding $1.5M per month from systems that previously produced a fraction of that.
The scoring paradox
The counterintuitive part: signal-based GTM systems still use scores. They just use them differently.
The score is no longer the routing mechanism. Signals route. The score is a monitoring metric that tells you how hot an account is across all active signals. It is a dashboard indicator, not a trigger. The distinction matters because it preserves signal context in the execution layer while still giving leadership a single number to track at the portfolio level.
Account scoring in this architecture aggregates signal intensity, signal recency, signal diversity, and signal velocity. An account showing one strong signal scores lower than an account showing three moderate signals because multi-signal accounts convert at higher rates. Recency weighting ensures that a pricing page visit last week counts more than one last quarter. Velocity captures acceleration: an account that went from zero signals to five signals in two weeks is hotter than one that accumulated five signals over six months.
This is still a score. But it serves a different function. It tells you which accounts to watch. The playbooks tell you what to do.
Building this without drowning

Building this without drowning translated into operating choices.
The most common objection I hear is complexity. Sixty playbooks sounds like sixty things to build, maintain, test, and debug. It sounds like a year-long infrastructure project that produces no pipeline until it is finished.
It does not have to work that way. The teams that succeed start with five playbooks covering their highest-converting signal types. Usually: pricing page visits from target accounts, competitive comparison activity, product usage spikes, funding events, and champion job changes. Five playbooks, built in two to three weeks, generating measurable pipeline within 30 days.
Then you add playbooks incrementally based on data. Which signal types are producing the most pipeline? Build more playbooks in that category. Which signals are you detecting but not acting on? Build a playbook. Which playbooks are firing but not converting? Fix or retire them.
The system grows organically. By month six, you have 25 playbooks. By month twelve, 50 or more. Each one justified by data from the playbooks that came before it.
The tooling stack matters here. You need a signal detection layer (Clay, 6sense, or Demandbase), an orchestration layer (Clay or a custom-built system), and an execution layer (your CRM, sequencing tool, and notification system). The total stack cost runs $3K to $15K per month depending on scale. Compared to the cost of the SDR team it partially replaces, the economics work at almost any deal size.
Where this is heading
Signal-based GTM is the natural architecture for AI-native revenue teams. The playbook library is a perfect abstraction for AI agents. Each playbook is a defined input, a decision tree, and a set of outputs. An agent can execute playbooks faster and more consistently than a human team, and it can run all 60 simultaneously without context-switching overhead.
The companies building signal-based systems today are building the infrastructure that AI agents will operate tomorrow. The playbook library is the agent’s instruction set. The detection layer feeds its sensory input. The enrichment stack provides its memory. The scoring layer directs its attention.
This convergence is already happening. Teams running signal-based GTM with AI agents in the execution layer are reporting pipeline numbers that were not achievable with either approach alone. The signal architecture gives the agents precision. The agents give the architecture speed. Together, they produce something that neither lead scoring nor manual prospecting can match.
The lead score had a good run. It solved a real problem in an era of linear buying journeys and limited data. That era is over. The buying signals are more varied, the detection capabilities are better, and the execution layer is faster than anything a single number can coordinate. Sixty playbooks, each one purpose-built for a specific buying moment, is how the next generation of B2B pipeline gets built.
Enjoying this essay?
Written by

Elom
GTM, growth, and revenue systems operator with 12 years across Fortune 500s, fintech, and B2B startups. Building at the intersection of AI, data, demand, and revenue.
Get the next deep-dive in your inbox
Essays on demand creation, GTM, growth engineering, and revenue systems. Free.